Why are the children so angry?
Do you know this woman?
 Hint: she addressed the largest ever gathering of world leaders at the United Nations Conference on Environment and Development in 1992. Severn Cullis-Suzuki was no ordinary 12 year old. She had a lot of big things to say. It was an impressive speech with a simple message about our environment: "please stop breaking it!".
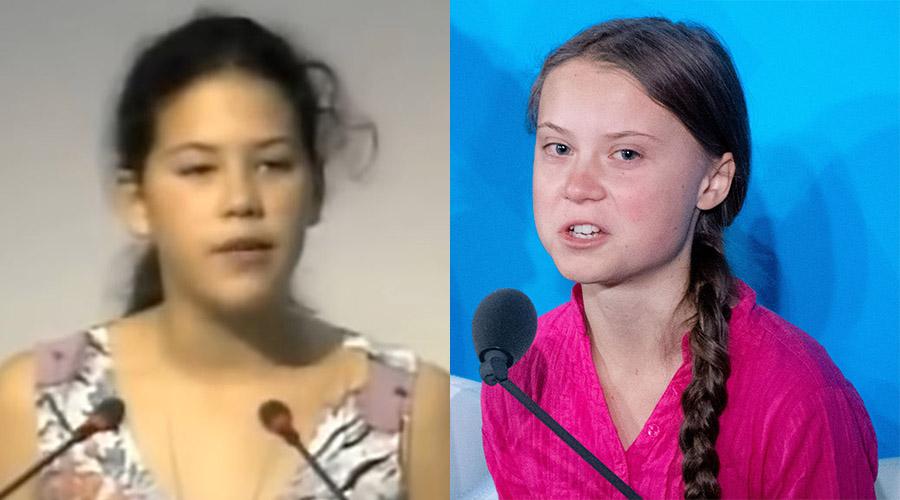 It went viral in 2008 and has 32 million views but you are more likely to be familiar with a rather more frustrated looking 16 year old Swedish child 27 years later. They had similar messages. Can you guess who said what?
You have to ask yourself, what do you expect. What do you expect to see, to experience, to feel, when global warming starts to spin out of control.
Is this really happening?

At the time of writing this article, 2019 was a year for beating records. A June 2019 heatwave in Europe was so exceptional that it got its own wiki page. The 5 hottest years on record were the previous 5 years. But while much of the media focused on Europe where lots of rich people live, the more dramatic peak above normal was in Greenland where it really matters in the long term. According to a simulation from the European Center for medium range forecasting, much of Greenland experienced highs of between 10 and 20 degrees centigrade above normal. Worrying enough for the National Snow and Ice Data Center to write an article about it.
One of the more vivid images of 2019 was the wildfires that were so prevalent throughout the globe. Siberia had the largest. According to Greenpeace it totalled 12 million hectares (121405 square kms) which if it was a country, would be in the top half of of the largest countries by area. 2019 looks to be an exceptional year and there were many other notable records. According to national geographic, Brazil had more rain forest cleared by the end of August than the previous 3 years combined . The UK had a record number of wildfires. Australia had a record start to the 2019/2020 season. Shane Fitzsimmons, the commissioner of the New South Wales(NSW) rural fire services in Australia, said in Nov 2019 that the current fires in NSW cover four times the land area that burned during the whole of 2018.
Knowing how many species are going extinct every day is a difficult question because we don't have a good catalog of species that exist today. Estimates vary dramatically from 2,000,000 species to 100,000,000 species. According to the WWF, even if we go with the lowest of the estimates, the extinction rate is orders of magnitude greater than the background extinction rate (the rate of extinction if humans were not around). According to a paper prepared for the united nations by two of leading researchers on the subject (Eric Chivian and Aaron Bernstein), climate change alone is anticipated to threaten with extinction approximately one quarter of all species on land by the year 2050. There is no agreement on the exact numbers but it is pretty unanimous that Sapiens have initiated the 6th mass extinction period. We have even given it a name (Holocene Extinction). And guess what, CO2 levels are a common theme among mass extinctions.
The population of the world is increasing. This does not make much of a difference in some parts of the world, for instance, a sparsely populated area of the first world. But in poorer parts of the world, particularly areas that are densely populated and in some kind of crises, it can often lead to conditions that make life extremely difficult for the people that live there. So much so, that people are risking life and limb to get out of there. We have always had economic migrants and refugees. But we are now seeing climate migrants. This is yet another metric which broke records in 2019. According to the Internal Displacement Monitoring Centre (IDMC), which has been using data from governments, UN humanitarian agencies and news accounts to publish annual reports since 2003, 7 million people were displaced from their home due to extreme weather events during the first half of 2019.
A leading daily news publication in the UK decided to change language they used to describe updates on the environment. it was not because they wanted to be more sensational. It was because the terminology that became the standard was so neutral, it had become inaccurate compared to what we are now seeing. Editor-in-chief of the Guardian, Katharine Viner, said: “We want to ensure that we are being scientifically precise, while also communicating clearly with readers on this very important issue”. In June 2019, Britain became the first country to declare a climate emergency. More countries have followed, enough to warrant a wikipedia page on countries who have made the declaration. An article in BioScience was signed by 11,000 reputable scientists from around the world. The stated goal of the article was to "tell it like it is".
The problem is clearly getting worse, not better despite all the talk. In fact, we are now on course to a level of carbon emissions that is considered to be twice the safe climate limit. Fossil fuel production plans are still on course to exceed the Paris Agreement levels.
Can there possibly be any more doubts
A common misconception was that the current global heating is due to some cycle in the energy emitted from the Sun. The energy emitted from the Sun that impacts the temperature on the earth is relatively stable. A simple comparison by NASA showed that the energy from the Sun is not causing global warming. This was a conclusion made on data going back to 1880. You can read about this on the Ask NASA Blog entry.
There are theories that we are actually about to enter a new ice age due to cyclical patterns in the temperature in the earth's atmosphere due to solar activity. However, experts from Potsdam University specializing in the area (Georg Feulner and Stefan Rahmstorf) are among many who dispel this theory. They have written a research letter explaining that even if we were entering a part of a cycle which would have reduced insolation (insolation means amount of energy from the Sun hitting the earth), it would have a very small impact on the earths temperature compared to the global warming we are seeing. The graph shown barley changes direction. They compare it to a grand solar minimum (a very low point in insolation).

Some will say that we continually go through cycles of the earths orbital patterns that are natural. The Milankovitch cyles are the most significant cycles. They are natural but they do not explain the temperature changes we are seeing today. They are well documented and fairly predictable. In fact, these cycles suggest we are in the middle of an ice age. And that we should be doing into a colder period between two interglacial periods (interglacial periods are warm periods in an ice age). We know all this from looking at temperature indicators going back lover long periods of time in ice trapped and excavated near the Russian weather station (Vostok Station) in the Antarctic.
According to Professor Martin Siegert (Co director of the Grantham Institute For Climate Change), the last time carbon dioxide levels were at this 800,000 year high, sea levels were 15-20 meters higher and a variety of beech tree grew at 300 miles from the south pole. We know this because the tree remains have been unearthed as fossils. He was speaking at a conference in London in April 2019 dedicated to the lessons we can learn from the period when carbon dioxide was last at this level. The graph was compiled by NASA from data from published papers.

In June 2019, researchers form the University of Turku in Finland suggests that even though observed changes in the climate are real, the effects of human activity on these changes are insignificant. The team suggests that the idea of man made climate change is a mere miscalculation or skewing the formulas by the Intergovernmental Panel on Climate Change (IPCC). This claim has been broadly refuted by climatefeedback.org.
Sometimes people doubt the trends because they say that they do not go back far enough or because they are speculative. We have lots of data of the atmosphere and temperatures going back millions of years because we can get data from ice buried at the arctic and the antarctic. This allows geologists can observe the patterns over that time. Richard Alley (professor of GeoSciences at Pensylvania State University) gives a very good description of CO2's role on climate based on this data. Dan Britt offers a similar review of different things that affect the climate. Although his focus is on asteroid and meteors, he personally took measurements of isotopric carbon molecolues (among other things) from ice. He comes to similar conclusions.
One discussion point that often makes people hesitant is the narrative that the drive towards renewables makes energy more expensive. However, a working paper produced by the IMF shows that the subsidies for hyrdocarbons are a massive 5.2 trillion dollars per year. ("Globally, subsidies remained large at $4.7 trillion (6.3 percent of global GDP) in 2015 and are projected at $5.2 trillion (6.5 percent of GDP) in 2017"). Metrics around energy subsidies are difficult to compare because different groups will have different definitions. Groups with interests in hyrdocarbons would prefer to leave out tax subsidies. Losses due to failed prospecting of hydrocarbons are often written off against future profits resulting in large reductions in tax bills. According to BP in their annual energy outlook, "renewable power consumption grew by 14% in 2018, providing 9% of the world’s electricity", (BP by the way have 20 billion barrels of oil equivalent proven hydrocarbon reserves). So in 2019, we can safely assume that it will be over 10%. That 10% does not include energy saved by people being inspired to cycle to work, insulate their home and business or adopt a plant based diet. It does not count health costs due to smog in cities. Nor does it consider the fact that the number of wars fought over wind farms or solar panels in the middle east still stands at ZERO. In fact, BP reckon that renewables will provide 30% of the world's energy by 2040. It is growing so fast, it is already making energy cheaper. While oil took almost 45 years to go from 1% of global energy to 10%, and gas took more than 50 years, renewables are expected to do so within 25 years in the report’s central scenario. China is a centralized government which is not heavily influenced by any renewable lobby. And yet China is by far the leader in building new renewable energy sources.
But if you still have any doubt, read NASA's summary of why NASA believes we are on a warming trajectory.
 The BBC news released an article on melting ice water. This chart shows likely scenarios. The source of the data is from a paper by Andy Ashwanden et al. Andy knows what he is writing about. He is a research associate professor in the Geophysical Institute Faculty associated with the University of Alaska Fairbanks. Similar numbers were predicted by a paper sponsored by the intergovernmental panel for climate change.
Lower the bar?
 It went viral in 2008 and has 32 million views but you are more likely to be familiar with a rather more frustrated looking 16 year old Swedish child 27 years later. They had similar messages. Can you guess who said what?
"Did you have to worry about these things when you were my age? I challenge you, please make your actions reflect your words.”
"You have stolen my dreams and my childhood with your empty words. "
Greta Thunberg had a much more angry disposition. Well she had a lot more to be angry about. In the intervening 27 years, global warming has sped up considerably and research has dismissed many of the possible doubts people could have harbored. And yet, we have more people releasing more carbon dioxide than ever before. Just as alarmingly, vast amounts of ice are melting more quickly than ever. Have a look at what NASA has to say about it from the satellite images they have been taking of the arctic since 1978.
What do you expect?
You have to ask yourself, what do you expect. What do you expect to see, to experience, to feel, when global warming starts to spin out of control.
- Melting of our ice sheets on a massive scale with dwindling ice at the polar regions.
- Rising sea levels causing record flooding.
- Hotter temperatures across the globe with record heatwaves most years leading to deaths in first world countries
- Unprecedented Fires over millions of acres of land in all parts of the globe
- Mass extinctions. Over 100 species per day.
- Millions of people who were so desperate due to climate change, that they will risk their lives and the lives of their infants, to make the most hazardous of journeys to richer countries or milder climates
- Increasingly alarming terminology in the media to describe the climate changes.
- Governments all over the world declaring climate emergencies.
What if all of these were happening. Would you make any conclusions? If you picture the building you are in right now, with one room increasingly prone to larger and larger fires. With water falling from the ceiling and filling up from the ground floor. Picture your pet mysteriously dying. Feel the temperature of the room you are in oscillating between much too hot and much too cold. People reporting on the conditions in other rooms in the building using increasingly alarmist language. Reports of people starting to die in another room while others start to desperately scream and bang on the door, or just jump through the window to get out. Finally, the company running the building announces there is state of emergency. Would you take any action. Maybe you are still not convinced that the situation is not as urgent as what the media articles are saying. If anything they are starting to crank up the rhetoric.
Is this really happening?

We have already seen what NASA thinks about the Arctic ice cap melting. But for more consumable way of showing just how dramatic it is, a good way of representing it is through spirals. Professor Ed Hawkins (Department of Meteorology, University of Reading and Principal Research scientist in the National Centre for Atmospheric Science) championed award winning representations in his climate lab book. This volume of ice at the arctic is represented by the distance of the line from the center. You can see it is smaller every Summer than it is in Winter. Although the ice volume is decreasing throughout the 80s and 90s, you have to concentrate on the spiral graphic to notice it. However, leave it play forward to the most recent 10 years, and the ice suddenly starts to dwindle. When you look at it in conjunction with what we saw earlier from NASA, you can see that it is melting in a way that is similar to the way a puddle melts. Losing it's depth more so than it's area. Eventually dwindling down to a thin layer of ice on top. So we can expect a sudden drop off of the reflection of the Suns heat once the thinner surface ice disappears.
 |
| Credit: X. Fettweis, Université of Liège, Belgium/MAR regional climate model |
Although the melting of the Arctic ice will lead to significant changes, it will not directly cause the sea level to rise because it is essentially made up of frozen water that is already in the water. Greenland and Antarctica on the other hand are a different story. Martin Olesen is a world expert on this. Greenland is part of the Kingdom of Denmark and he works for the Danish Meteorological Institute | (DMI) Center for Atmospheric Physics and Observations. He has several publications on climate change, and much of his research is focused on the ice in Greenland. The Danish Meterological Institute uses satellite imaging among other data sources to determine the volume of ice and volume of melting in Greenland. According to estimates from the institute, 2018 was very dramatic. In that one single year, the net rise of global sea levels due to the melt water in Greenland was 1mm. That compares starkly with the 2mm that was contributed previously since the start of the industrial age. In July of 2019, the melt-water contributed almost 200 Gigatonnes to the ocean. That is equivalent to twice the annual rainfall of the whole of the island of Ireland. Can you find the point in time where the melt water was 5 times larger than the average.
 |
| European model simulation of temperature difference from normal over Greenland on June 12th 2019. (WeatherBell.com) |
At the time of writing this article, 2019 was a year for beating records. A June 2019 heatwave in Europe was so exceptional that it got its own wiki page. The 5 hottest years on record were the previous 5 years. But while much of the media focused on Europe where lots of rich people live, the more dramatic peak above normal was in Greenland where it really matters in the long term. According to a simulation from the European Center for medium range forecasting, much of Greenland experienced highs of between 10 and 20 degrees centigrade above normal. Worrying enough for the National Snow and Ice Data Center to write an article about it.
 |
| University of Bern |
 |
| MRonline |
Knowing how many species are going extinct every day is a difficult question because we don't have a good catalog of species that exist today. Estimates vary dramatically from 2,000,000 species to 100,000,000 species. According to the WWF, even if we go with the lowest of the estimates, the extinction rate is orders of magnitude greater than the background extinction rate (the rate of extinction if humans were not around). According to a paper prepared for the united nations by two of leading researchers on the subject (Eric Chivian and Aaron Bernstein), climate change alone is anticipated to threaten with extinction approximately one quarter of all species on land by the year 2050. There is no agreement on the exact numbers but it is pretty unanimous that Sapiens have initiated the 6th mass extinction period. We have even given it a name (Holocene Extinction). And guess what, CO2 levels are a common theme among mass extinctions.
 |
| Flod waters |
 |
| FromWikipedia Countries who have declared a climate emergency |
The problem is clearly getting worse, not better despite all the talk. In fact, we are now on course to a level of carbon emissions that is considered to be twice the safe climate limit. Fossil fuel production plans are still on course to exceed the Paris Agreement levels.
 |
| productiongap.org 2019 Report |
Can there possibly be any more doubts
A common misconception was that the current global heating is due to some cycle in the energy emitted from the Sun. The energy emitted from the Sun that impacts the temperature on the earth is relatively stable. A simple comparison by NASA showed that the energy from the Sun is not causing global warming. This was a conclusion made on data going back to 1880. You can read about this on the Ask NASA Blog entry.
 |
| From Ask NASA Blog |
There are theories that we are actually about to enter a new ice age due to cyclical patterns in the temperature in the earth's atmosphere due to solar activity. However, experts from Potsdam University specializing in the area (Georg Feulner and Stefan Rahmstorf) are among many who dispel this theory. They have written a research letter explaining that even if we were entering a part of a cycle which would have reduced insolation (insolation means amount of energy from the Sun hitting the earth), it would have a very small impact on the earths temperature compared to the global warming we are seeing. The graph shown barley changes direction. They compare it to a grand solar minimum (a very low point in insolation).

Some will say that we continually go through cycles of the earths orbital patterns that are natural. The Milankovitch cyles are the most significant cycles. They are natural but they do not explain the temperature changes we are seeing today. They are well documented and fairly predictable. In fact, these cycles suggest we are in the middle of an ice age. And that we should be doing into a colder period between two interglacial periods (interglacial periods are warm periods in an ice age). We know all this from looking at temperature indicators going back lover long periods of time in ice trapped and excavated near the Russian weather station (Vostok Station) in the Antarctic.
 |
| Temperature change at Vostok, Antarctica (Petit 2000). Interglacial periods are marked in green. |
According to Professor Martin Siegert (Co director of the Grantham Institute For Climate Change), the last time carbon dioxide levels were at this 800,000 year high, sea levels were 15-20 meters higher and a variety of beech tree grew at 300 miles from the south pole. We know this because the tree remains have been unearthed as fossils. He was speaking at a conference in London in April 2019 dedicated to the lessons we can learn from the period when carbon dioxide was last at this level. The graph was compiled by NASA from data from published papers.

In June 2019, researchers form the University of Turku in Finland suggests that even though observed changes in the climate are real, the effects of human activity on these changes are insignificant. The team suggests that the idea of man made climate change is a mere miscalculation or skewing the formulas by the Intergovernmental Panel on Climate Change (IPCC). This claim has been broadly refuted by climatefeedback.org.
Sometimes people doubt the trends because they say that they do not go back far enough or because they are speculative. We have lots of data of the atmosphere and temperatures going back millions of years because we can get data from ice buried at the arctic and the antarctic. This allows geologists can observe the patterns over that time. Richard Alley (professor of GeoSciences at Pensylvania State University) gives a very good description of CO2's role on climate based on this data. Dan Britt offers a similar review of different things that affect the climate. Although his focus is on asteroid and meteors, he personally took measurements of isotopric carbon molecolues (among other things) from ice. He comes to similar conclusions.
One discussion point that often makes people hesitant is the narrative that the drive towards renewables makes energy more expensive. However, a working paper produced by the IMF shows that the subsidies for hyrdocarbons are a massive 5.2 trillion dollars per year. ("Globally, subsidies remained large at $4.7 trillion (6.3 percent of global GDP) in 2015 and are projected at $5.2 trillion (6.5 percent of GDP) in 2017"). Metrics around energy subsidies are difficult to compare because different groups will have different definitions. Groups with interests in hyrdocarbons would prefer to leave out tax subsidies. Losses due to failed prospecting of hydrocarbons are often written off against future profits resulting in large reductions in tax bills. According to BP in their annual energy outlook, "renewable power consumption grew by 14% in 2018, providing 9% of the world’s electricity", (BP by the way have 20 billion barrels of oil equivalent proven hydrocarbon reserves). So in 2019, we can safely assume that it will be over 10%. That 10% does not include energy saved by people being inspired to cycle to work, insulate their home and business or adopt a plant based diet. It does not count health costs due to smog in cities. Nor does it consider the fact that the number of wars fought over wind farms or solar panels in the middle east still stands at ZERO. In fact, BP reckon that renewables will provide 30% of the world's energy by 2040. It is growing so fast, it is already making energy cheaper. While oil took almost 45 years to go from 1% of global energy to 10%, and gas took more than 50 years, renewables are expected to do so within 25 years in the report’s central scenario. China is a centralized government which is not heavily influenced by any renewable lobby. And yet China is by far the leader in building new renewable energy sources.
But if you still have any doubt, read NASA's summary of why NASA believes we are on a warming trajectory.
Where are we going?

Lower the bar?
My life ambition was once to pass on a better world to my children. Now, I would be content with passing on a world to my children. An inhabitable one. Why? Because of global heating. But there is a silver lining. No-one and no country can solve these problems in isolation. We all have to work together on this, sharing ideas, processes and technology. And, we all have to pull our own weight.
On a personal level, I am astounded at the rate of acceleration global heating. I hear commentators talking about changing for the sake of our grandchildren. We don't need to wait. We don't need to wait for all of society to have a meltdown (no pun intended) or for our own residence to be submerged by sea water before acting. There are millions suffering everyday already. The sea level increases are alarming. The climate heating is breaking records every year. It is real. It now. And it's not a fad. It's not like flares, a Rubik's cube or a yo-yo.
As individuals it's easy to think: "Anything I do will make little or no difference. I like eating meat. I live to far from work to take public transport. I can't do without my holiday thousands of miles away. I am not fit enough to cycle to work". Well compared to lowering the sea level back down, these are a stroll in the park to change. So let's take a stroll together. Begin by taking a baby step, put one foot in front of the other. Bring as many as your friends and family along as you can. There is no point in waiting to be told to do it by a government before it is too late. That time has come and gone. That message would never get elected. Not in time anyway.


Comments
Post a Comment